PDB Tutorial
- Home
- Jmol Tutorial 1
- Jmol Tutorial 2
- Jmol Tutorial 3
- Jmol Commands
- Resources Pages
- PDB Tutorial
- SMART Teams
Symposium
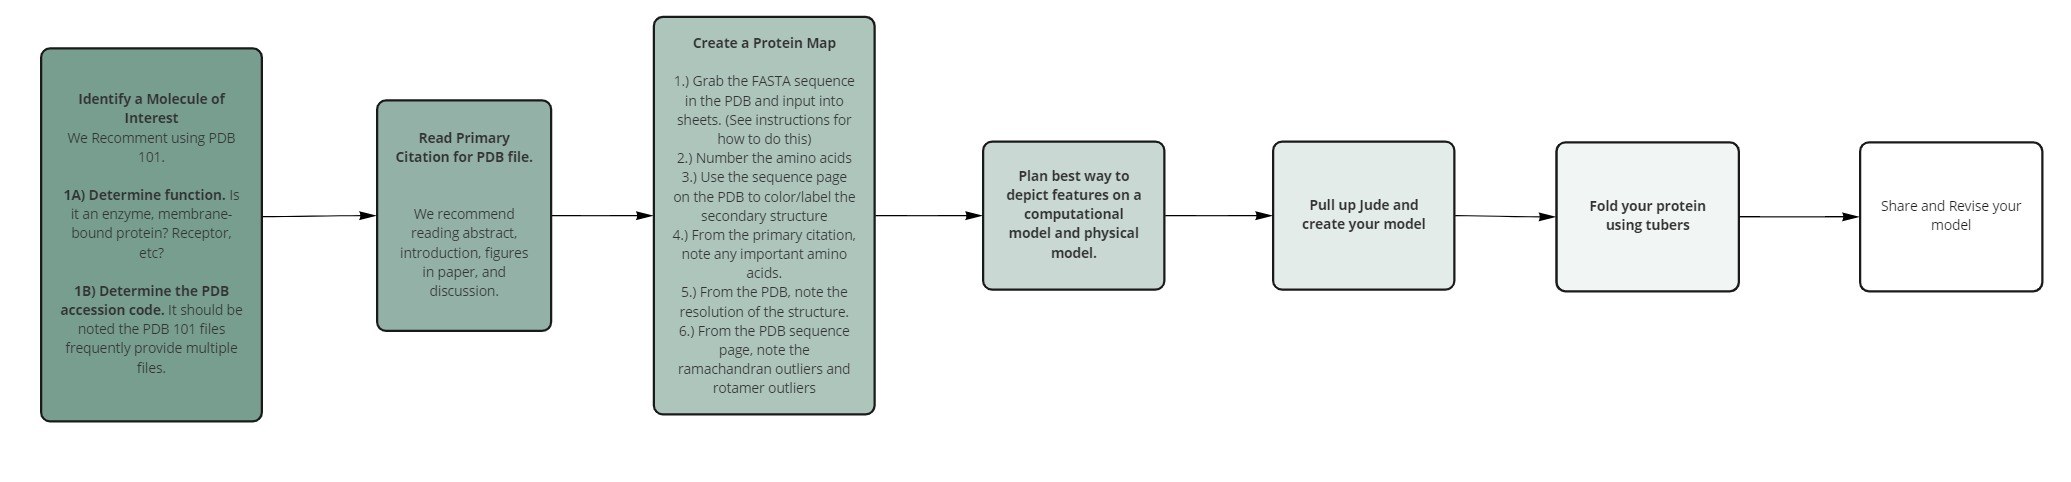
Part 1 - Designing a Molecular Story
The protein data bank is an excellent resource for you and your students to explore structure and function relationships. We recommend doing this through the creation of molecular stories. During this workshop, we will be guiding you through how to create and explore a molecular story with your students. During the first part of the workshop, we will guide you through the molecular story of insulin. Then, you will have an opportunity to explore and create a molecular story with a Penn State research mentor. Below is a process you can follow to create your own molecular stories. We will follow this process for Insulin.
1. Protein Data Bank File
The protein data bank is a repository of 3D shapes of proteins, nucleic acids, and complex assemblies that helps students and researchers understand structure function relationships. The Protein Data Bank can be found at https://www.rcsb.org/.
Each file in the protein data bank has a four letter/number identifier. For human insulin the file identifier is 2HIU. You can enter this into the search bar on the Protein Data Bank or follow the link below:
https://www.rcsb.org/structure/2HIU
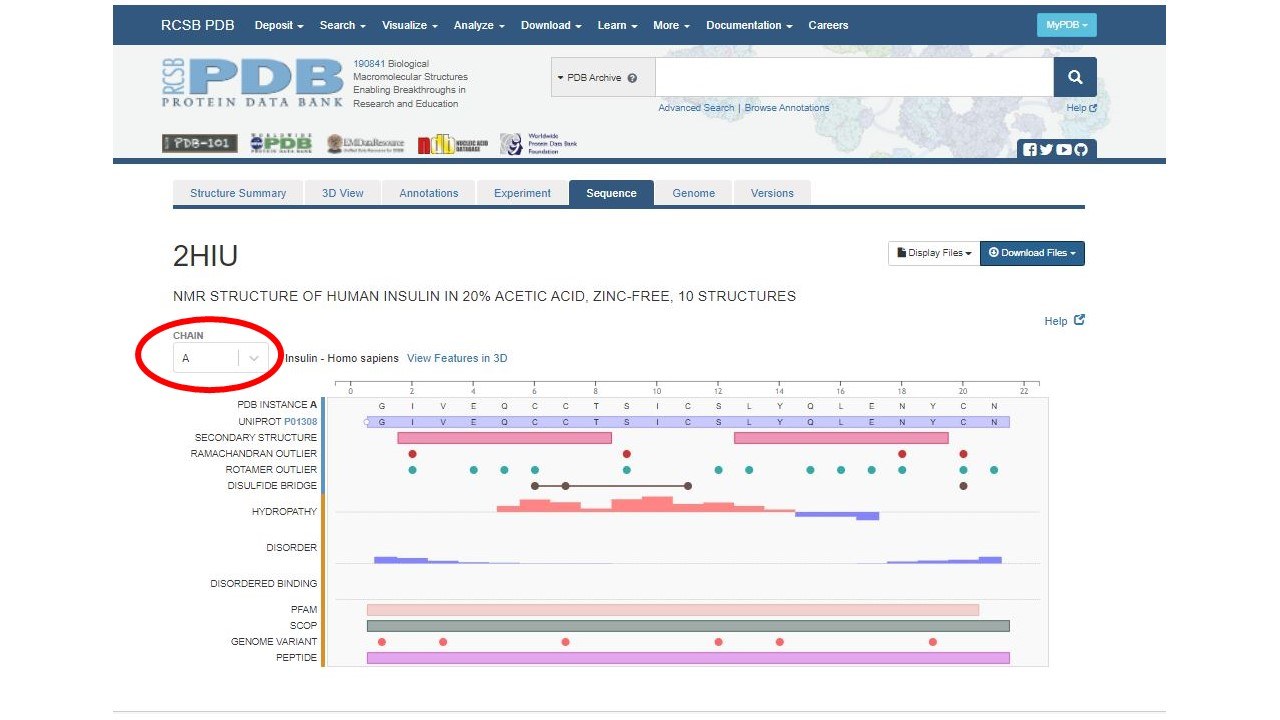
When you get to this page, it will look like the page below.
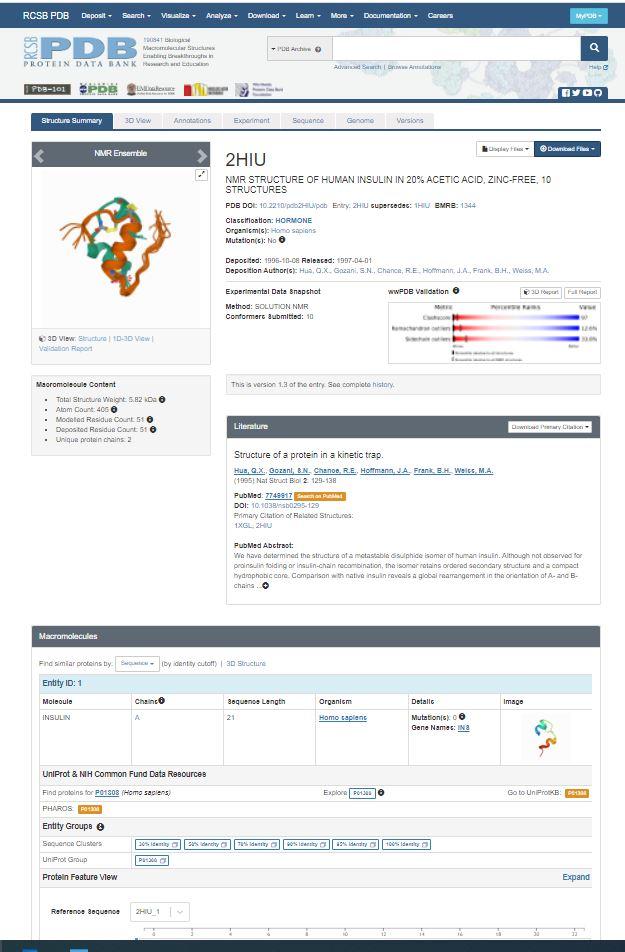
This page has some valuable information about the structure. Let's see if we can find the following information:
1) What is this structure classified as (see "classification')? What does this mean about the function of this molecule?
2) What organism is this protein from?
2. Resolution
Resolution is a measure of the quality of the data that has been collected on the crystal containing the protein. Essentially, resolution is a measure of the level of detail present in the structure. High-resolution structures (less than or equal to 1 angstrom) are highly ordered and it is easy to see every atom in the electron density map. Lower resolution structures (greater than or equal to 3 angstroms) show only the basic contours of the protein chain, and the atomic structure must be inferred. I.E. the higher the resolution of the structure, the greater the uncertainty in the structure of the model.
1. Find the resolution on the 2HIU pdb page. What is the resolution of our 2HIU file?
3. Literature
A great place to start finding information about your molecule is the Literature section of the 2HIU PDB page (https://www.rcsb.org/structure/2HIU). Scroll down to Literature. The Literature section will provide you with the primary citation. While parts of the article may be difficult for you to read, it can be a great source of information for you. We recommend reading the abstract, introduction, and discussion. In addition, we recommend looking at all of the figures. When reading a scientific journal article for the first time, you do not need to understand every single word. The idea is to get the big picture about the structure of the molecule.
If you want more information on how to read scientific journal articles, check out the three pass approach.
4. Macromolecules
Don't panic, though, the 2HIU file PDB page can also provide you with lots of other information. Including a section on macromolecules, that will tell you the names of the protein chains and how many protein chains there are in the protein. Scroll down to find the macromolecules section and answer the following questions:
1. Find the macromolecules section of the 2HIU pdb page. List the name(s) of the protein chains.
2. How many protein chains are found in human insulin?
5. Small Molecules
Some proteins will have small molecules found in them. The small molecules, if present, can be found in the small molecules section.
1. Does the 2HIU file have any small molecules? If so, list the names of the molecules?
6. Sequence
In addition, to the structure summary page, the sequence page contains a wealth of information.
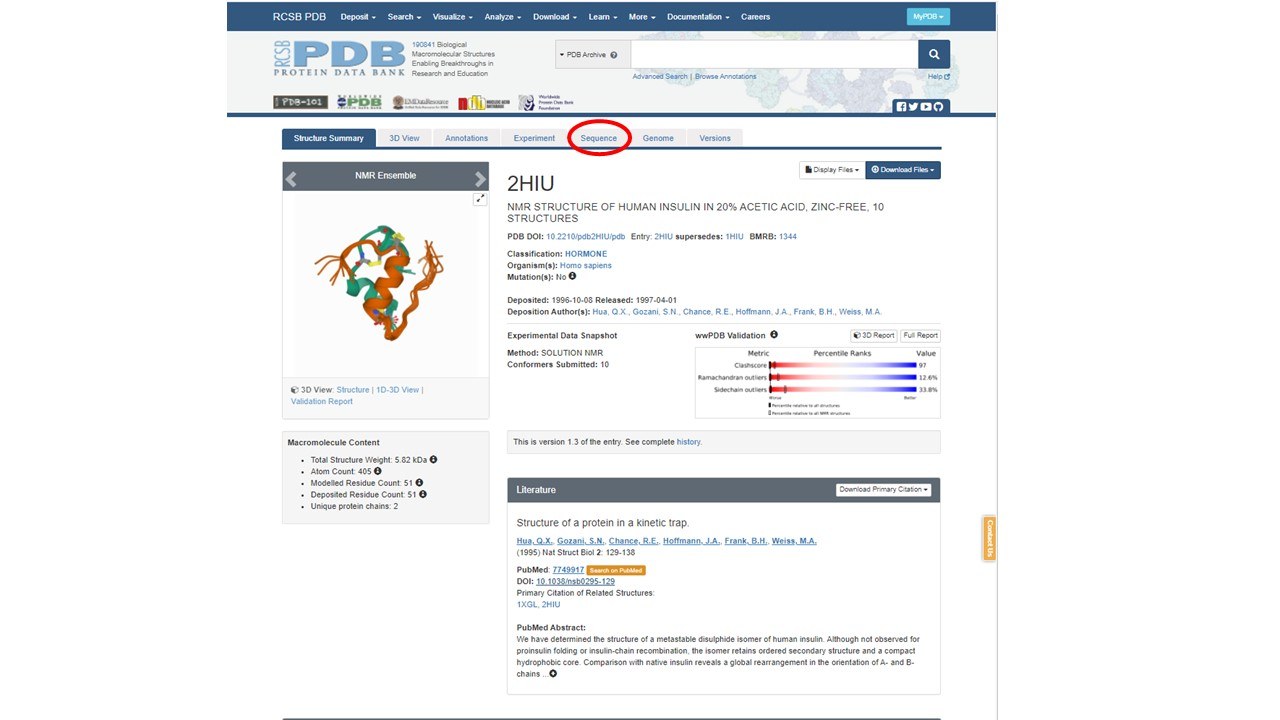
The sequence page will look like this:
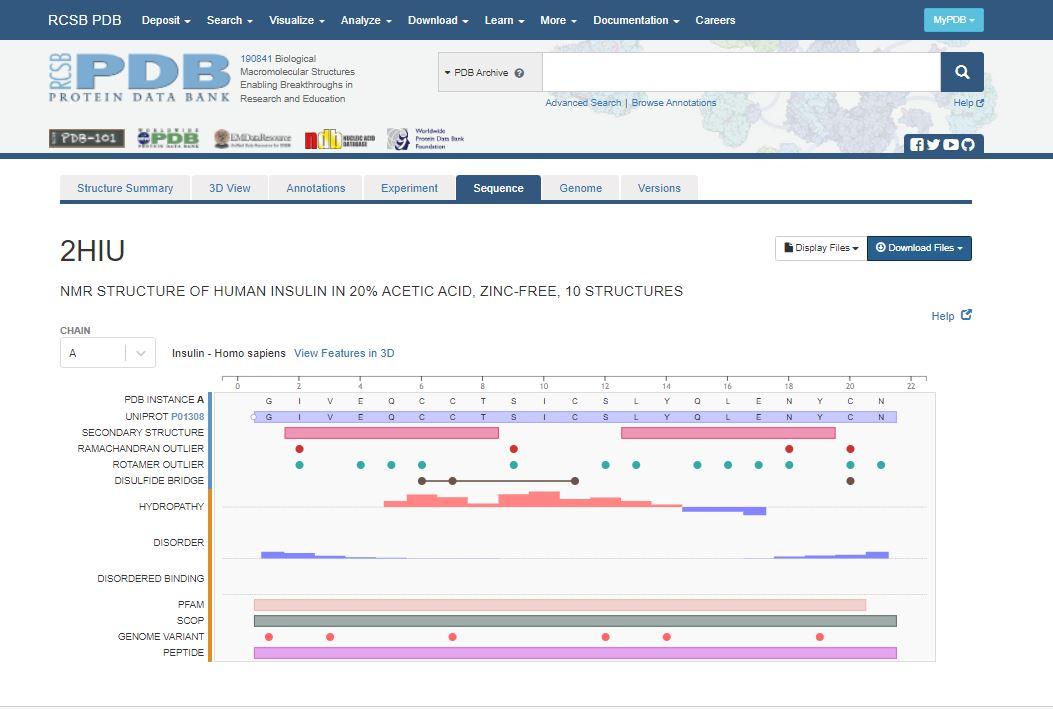
Currently the sequence page is showing you information about chain A. You can change to display information about chain B, by clicking the drop down Chain menu on the left of the page.
Chain B sequence data will look like this:
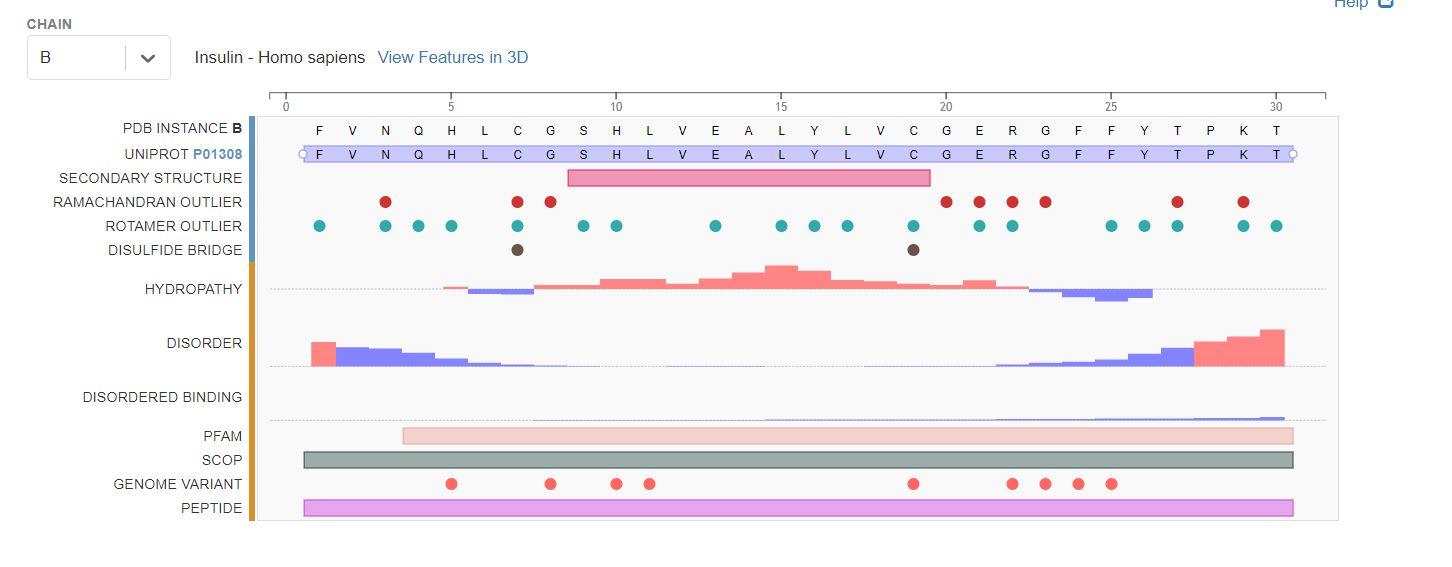
We can pull a lot of information from this page, including:
- The primary sequence of each chain
- The secondary structure
- Ramachandran Outliers
- Rotamer Outliers
- Location of disulfide bonds
- Binding site of small molecules/ligands
7. Creating a Protein Map
We recommend synthesizing this information in a protein map that you create. To create your protein map, open up a google sheets.
- Title your google sheet 2HIU Insulin Protein Map.
- You will need two tabs. One tab is already made for you, you can rename this Chain A. The second tab you will need to click + at the bottom right of the screen.
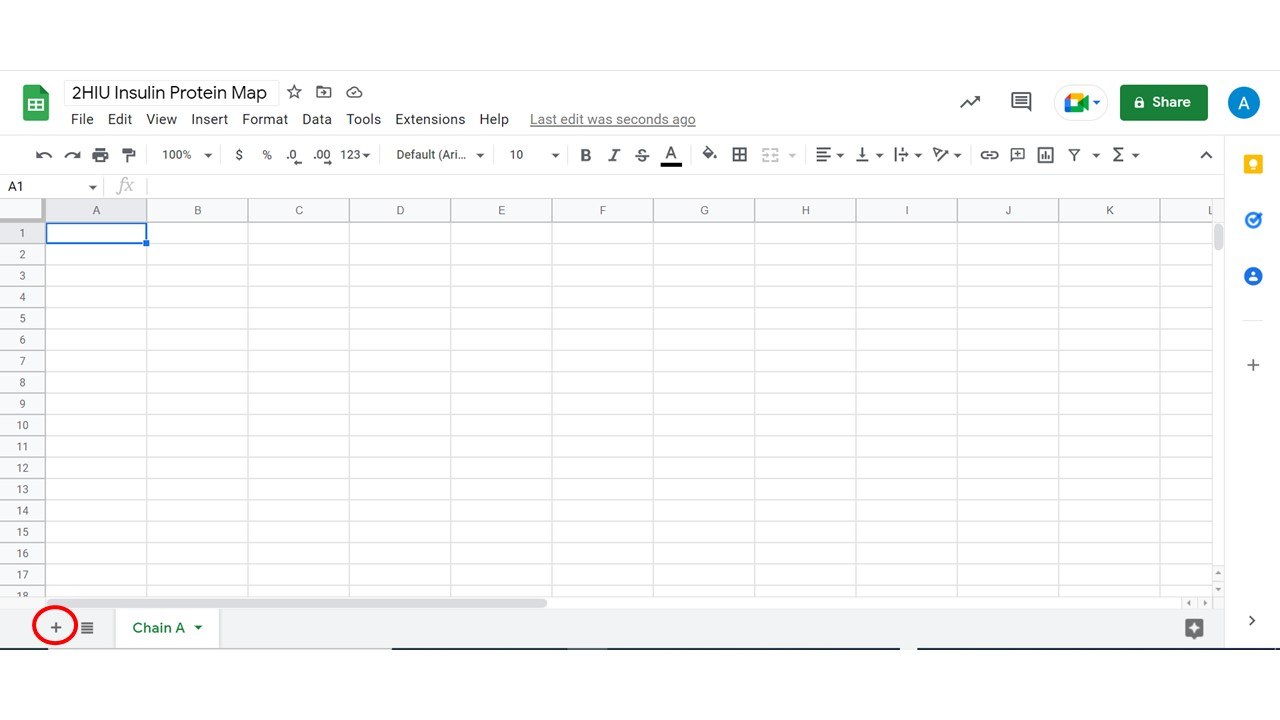
3. Once you have added a tab, label it Chain B.
4. We now need to grab our primary amino acid sequence from the pdb. To get the primary amino acid sequence, click download files, then click FASTA sequence.
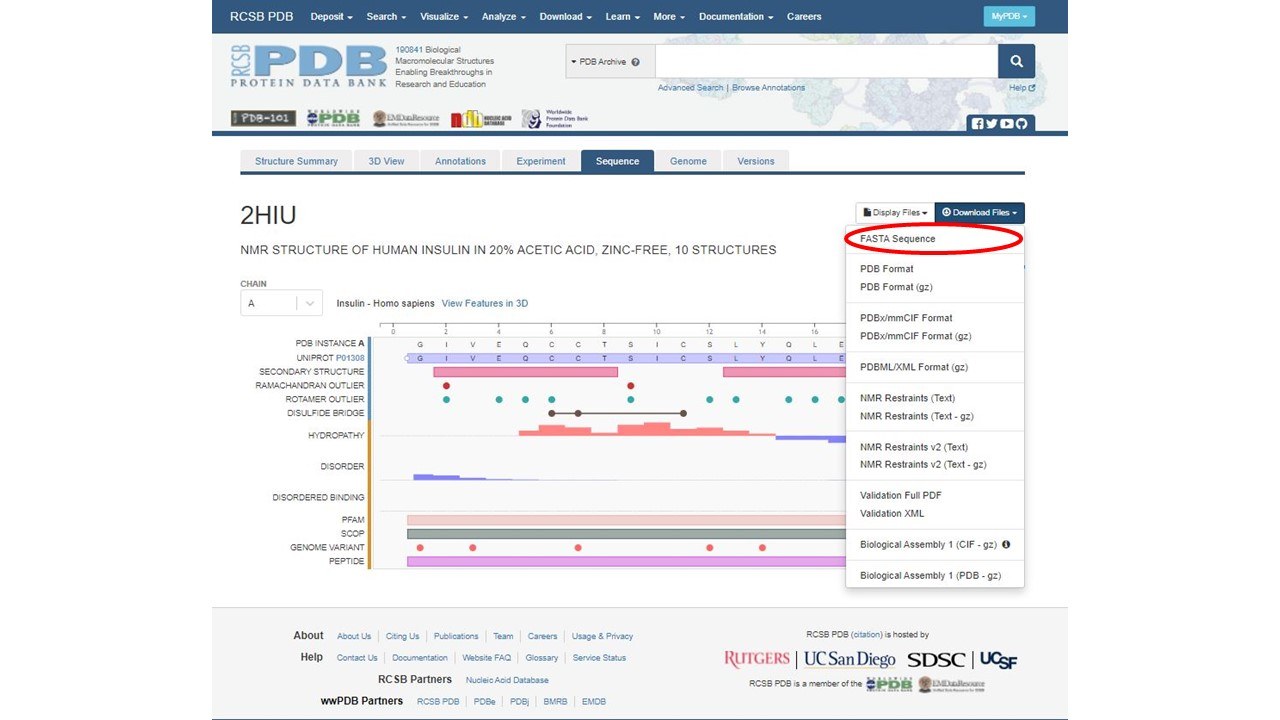
You can open this FASTA sequence in notepad. It will look like this:
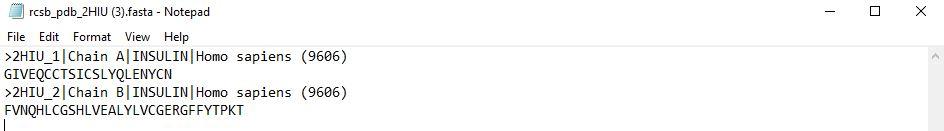
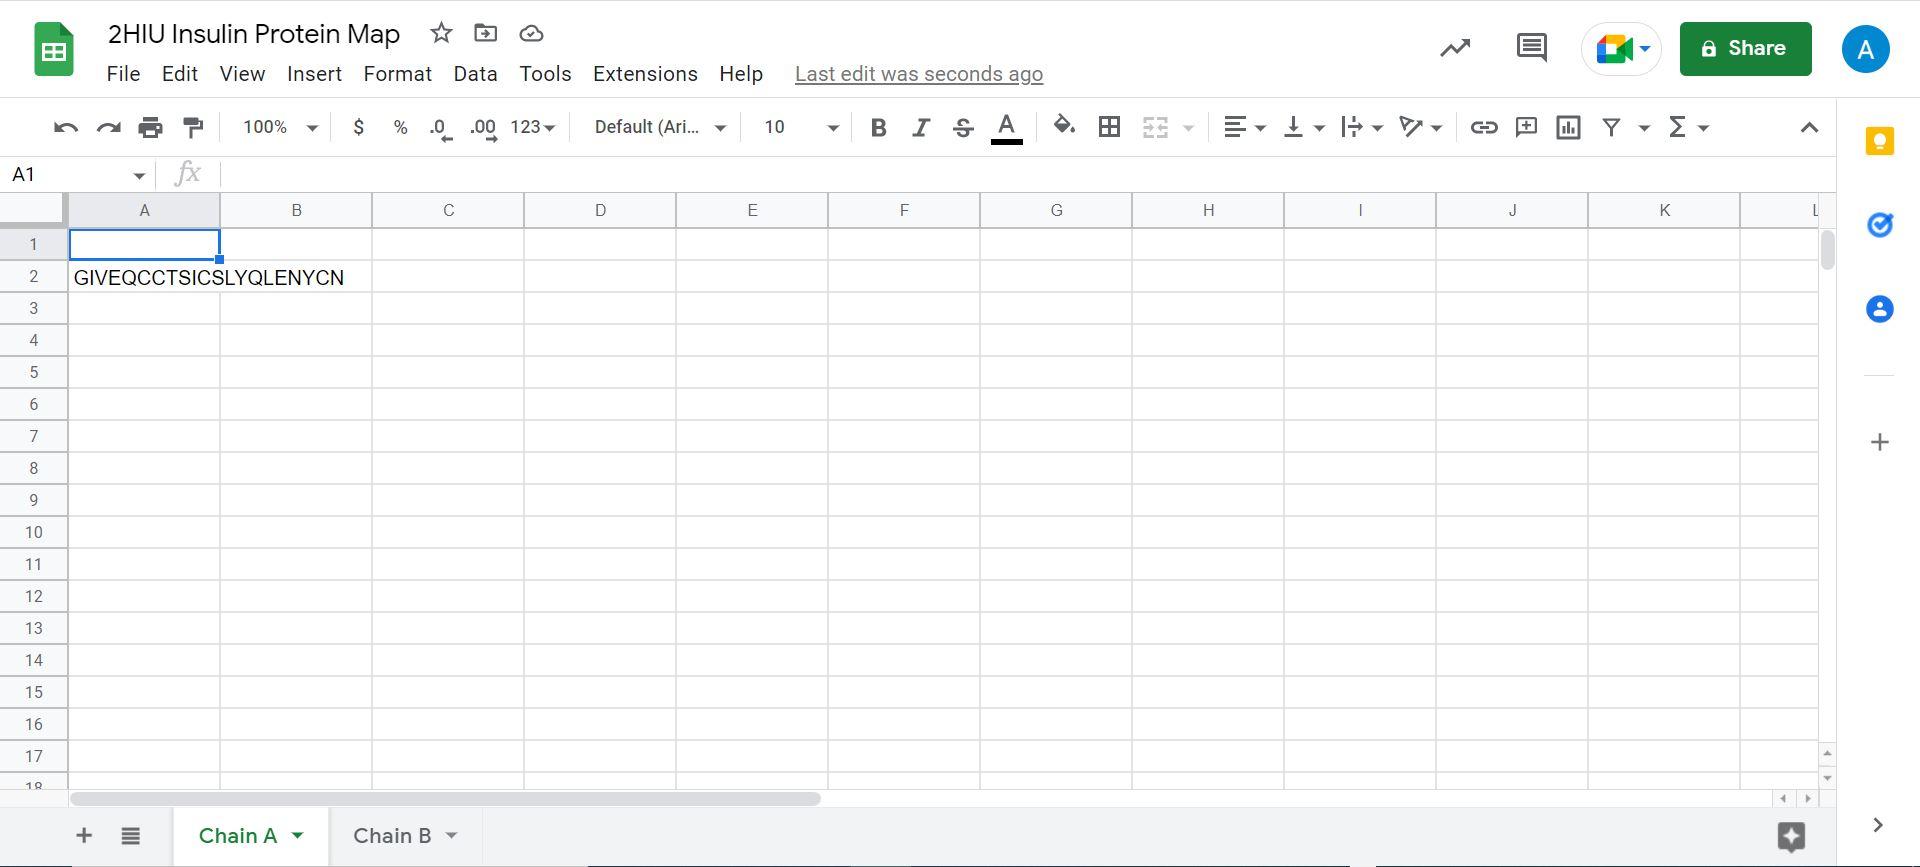
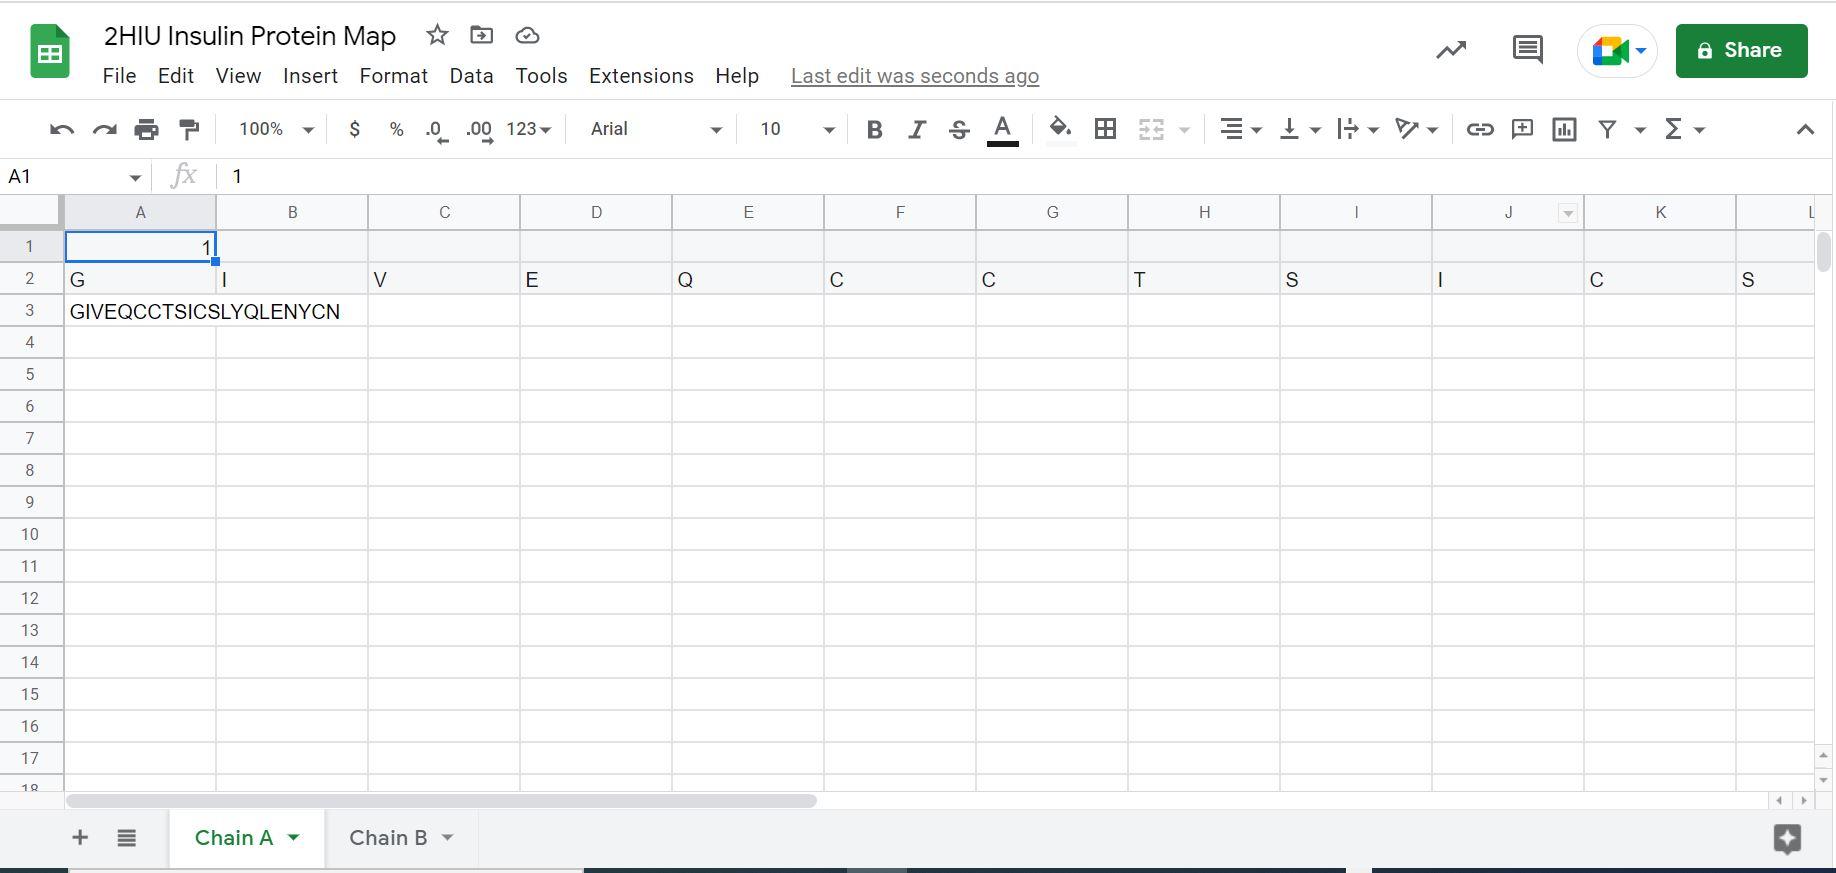
4. Copy the chain A sequence and paste in cell A2 in the Chain A tab.
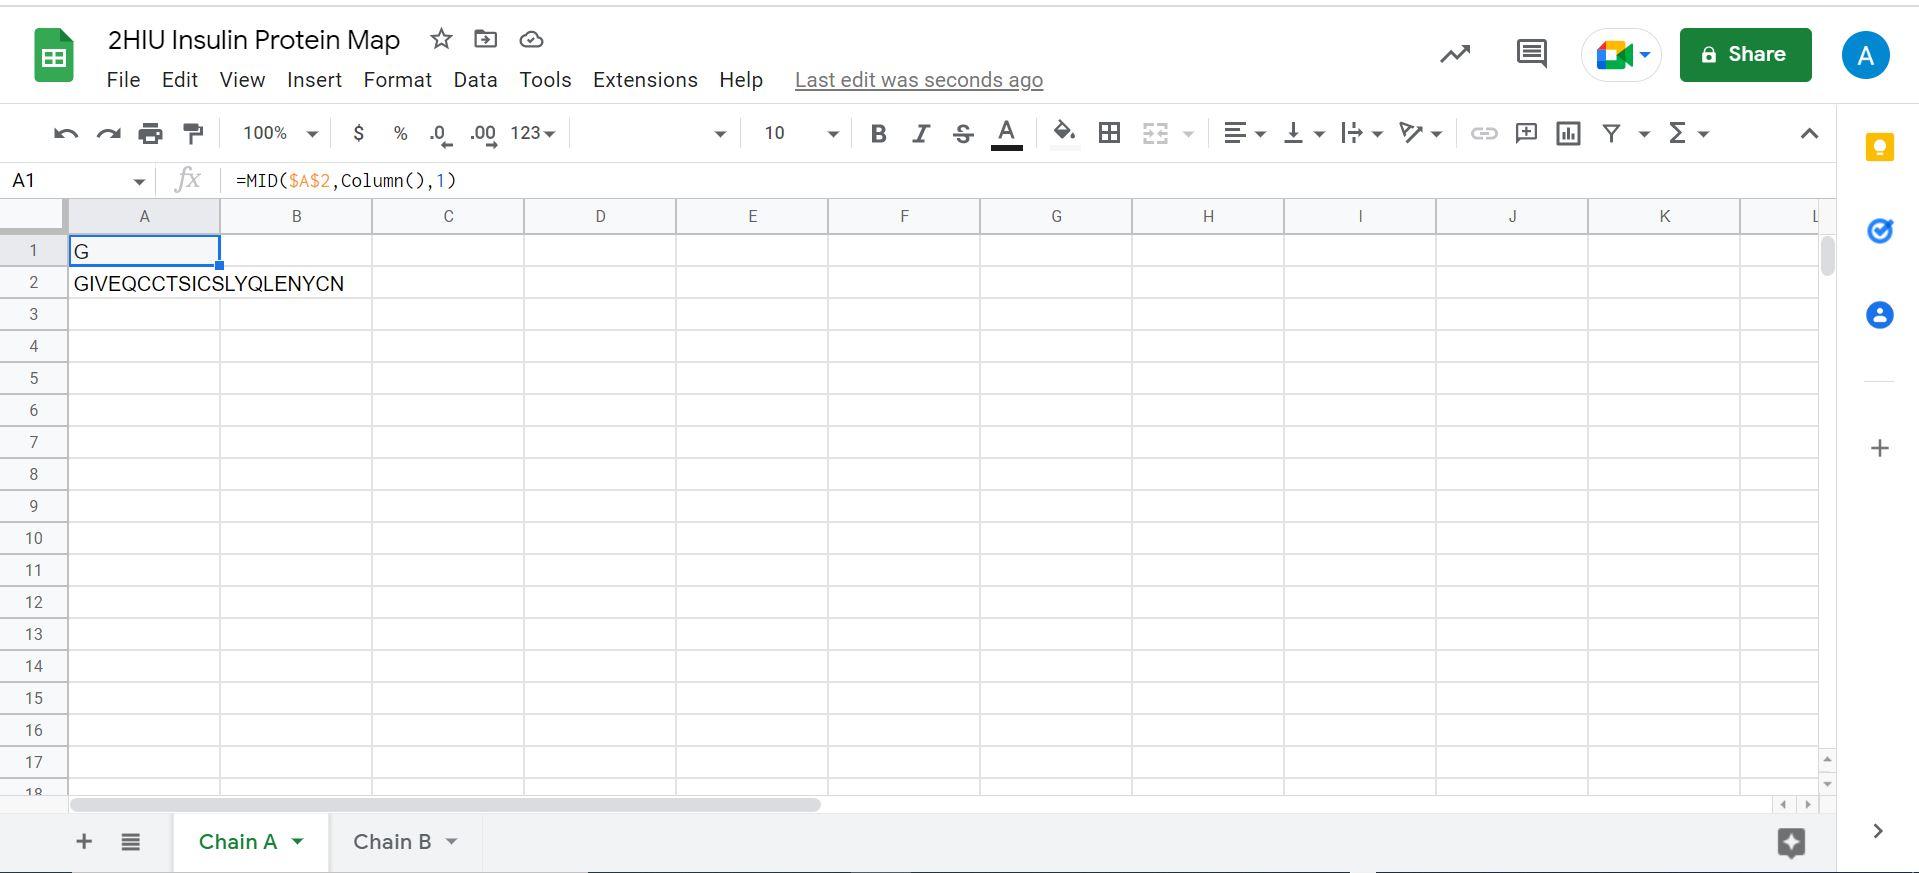
5. Copy the following formula in cell A1 in the Chain A tab:
=MID($A$2,Column(),1)
It will look like this in excel:
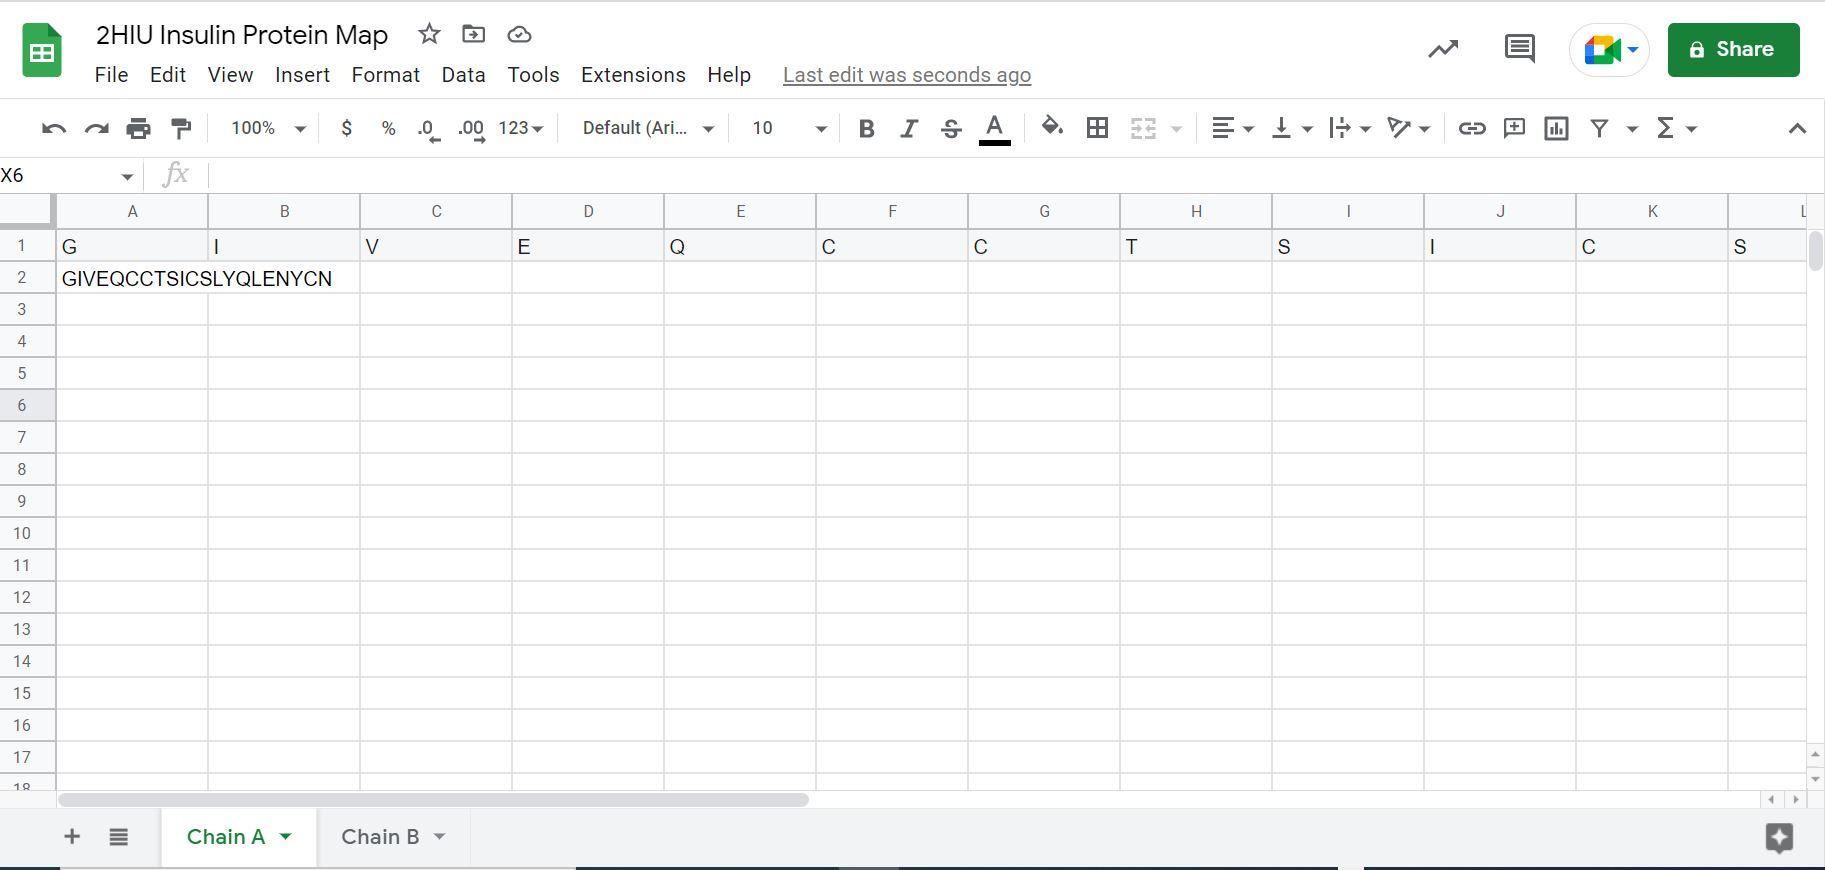
To get the rest of you sequence to appear, click the bottom right of cell A1 and drag across until letters stop appearing in each cell. Once you have done this you will have a letter in each cell up to cell U. It will look like this:
6. Now click the Chain B tab, and add 1 column by right clicking, then click + insert 1 column to the left. Repeat this three times.
7. Repeat steps 4 and 5 for Chain B in tab Chain B.
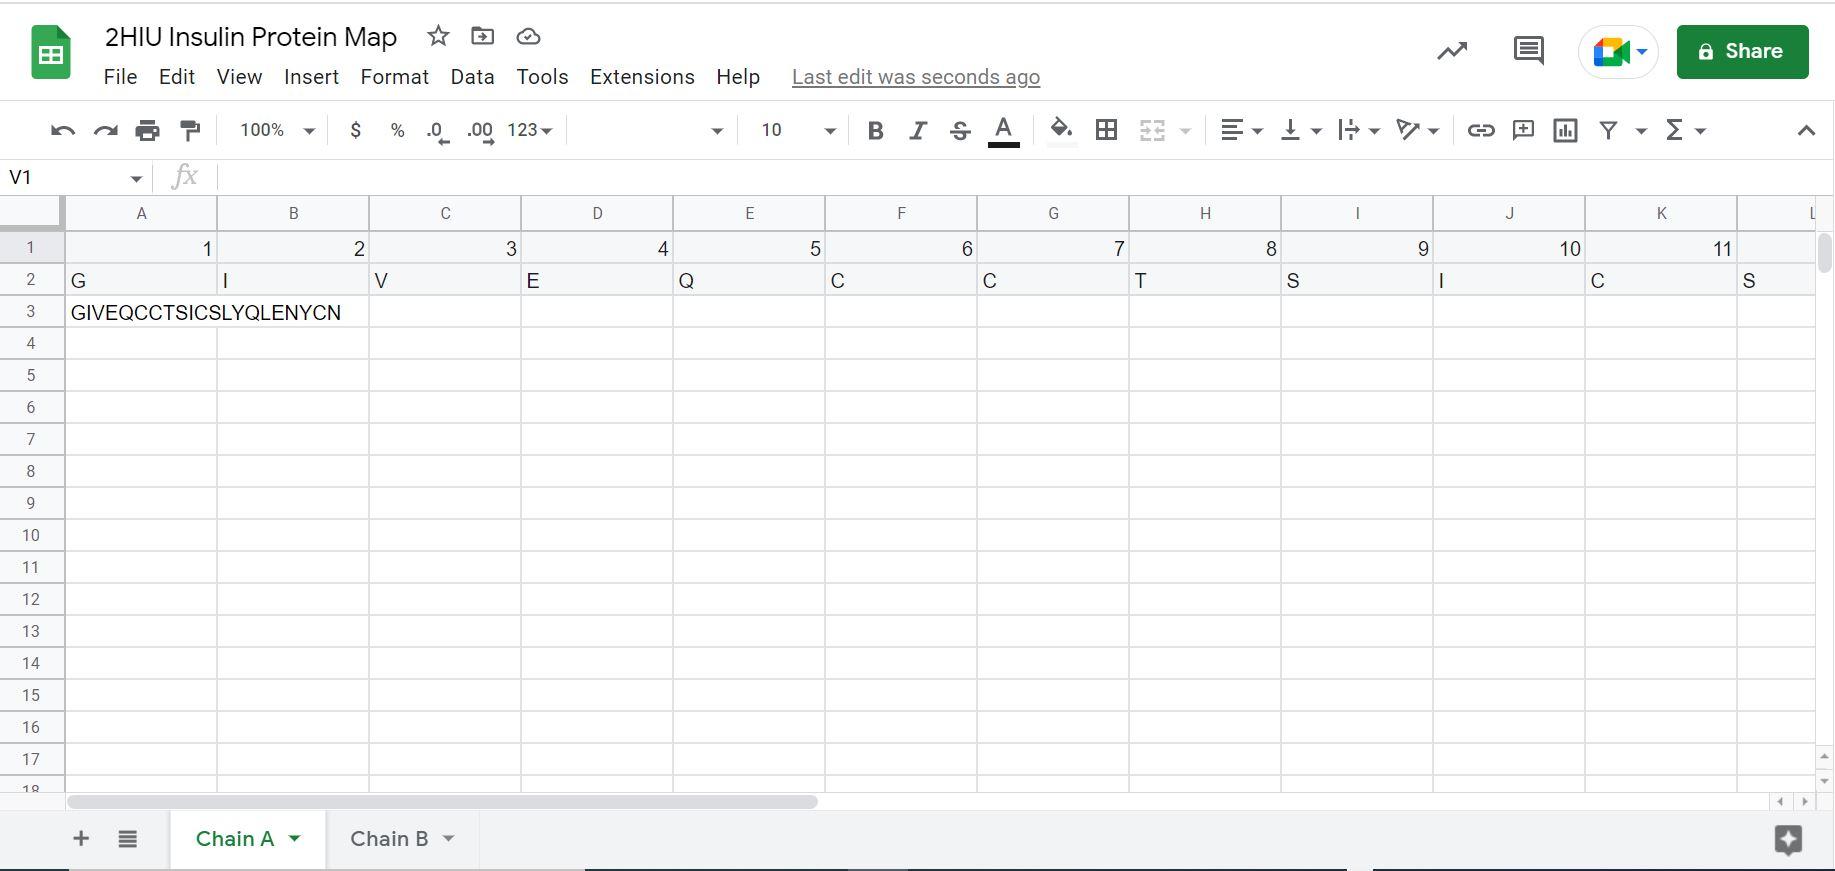
8. In the Chain A tab, right click on cell A1, and click + insert 1 row above. In the new A1 cell, input the number 1.
Then, in B1 input the following formula:
=A1+1
Then drag across so each of your amino acids are inputted. It will look like this when you are finished:
9. Repeat step 8 for the Chain B tab.
10. In the Chain A tab, right click on cell A3 and click +insert one row above. Repeat this four times to add a total of five rows.
11. Repeat Step 10 in the Chain B tab.
12. Now for each chain, fill in the following:
- In row 3, write the three letter code for each amino acid using the amino acid side chain chart.
- In row 4, color the location of the secondary structures. You can color the alpha helices red and the beta pleated sheets yellow.
- In row 5, mark the disulfide bridges.
- In row 6, mark the ramachandran outliers.
- In row 7, mark the rotamer outliers.
8. Insulin: mRNA to Protein Kit
From your Insulin: mRNA to protein Kit grab the protein folding map. Compare your protein map to the map of the kit.
1. What do you notice?
2. What questions do you have?